Flight Analysis topographic maps copyright © (1996-2003) Bartholomew Digital Data |
||
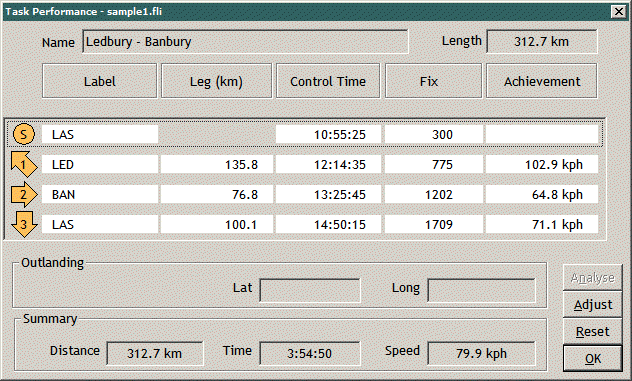 |
Use the Task Performance The
control time The
next pictures |
|
 |
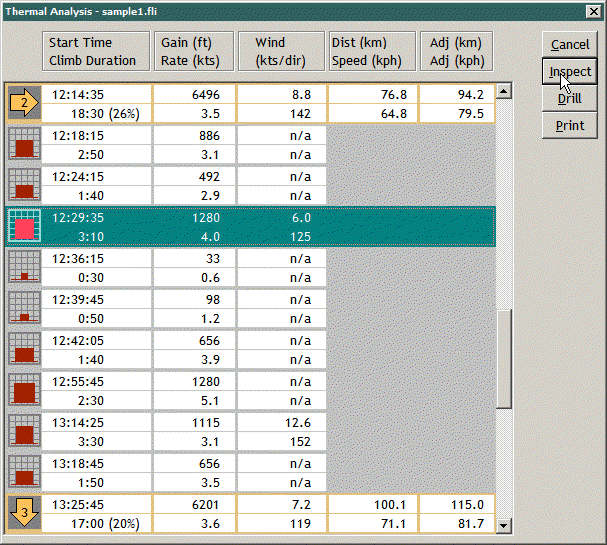
Use the Use the
Drill button The
next picture |
|
 |
This picture shows Use the Drill button Use
the Map button |
|
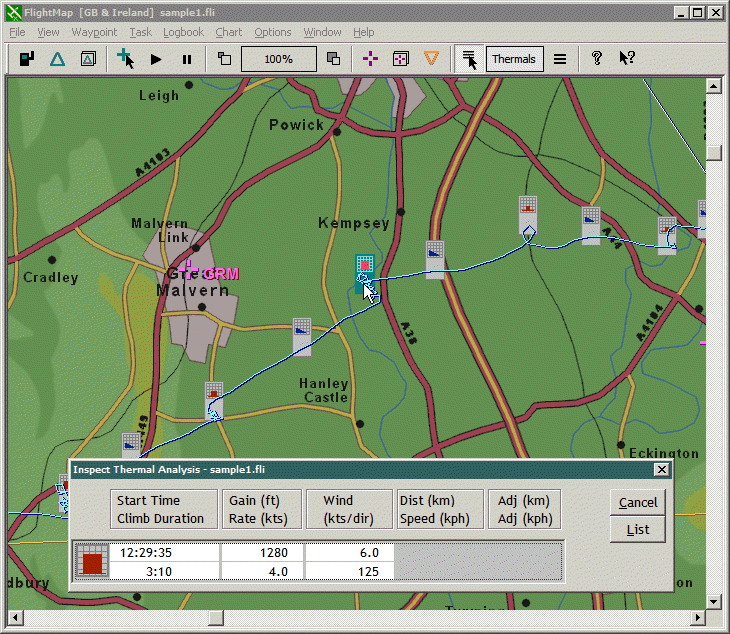 |
The
results of Use the Inspect The next picture |
|
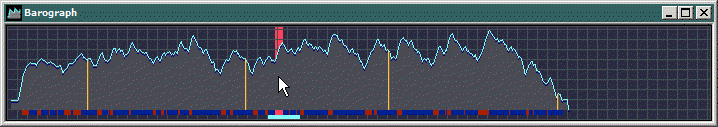 |
The
Barograph In this
picture, |
|